London Charter
In the age of Generative AI, what does it mean to develop a principled historical 3D visualization? Running Reality strives for full compliance with the principles of the London Charter so that you can distinguish inferred visualizations from data visualizations when using Running Reality. Following these principles lets visitors better imagine history while preserving methodological rigor.
Overview
The London Charter for the Computer-based Visualisation of Cultural Heritage is the leading set of principles for digital history projects to ensure they follow sufficient methodological rigor. Running Reality attempts to follow these principles.
Have you seen fully immersive 3D reconstructions of ancient cities on the internet? There are some really amazing and well researched videos on YouTube. However, social media is also now being flooded with easy to make Generative AI videos purporting to be ancient scenes. These Generative AI videos are an extraordinary technical achievement and improve in their accuracy with each passing month. However, even if it is fairly accurate, there is no transparency, citation, or auditability. How can we keep up with Generative AI and hold to our principles of accuracy?
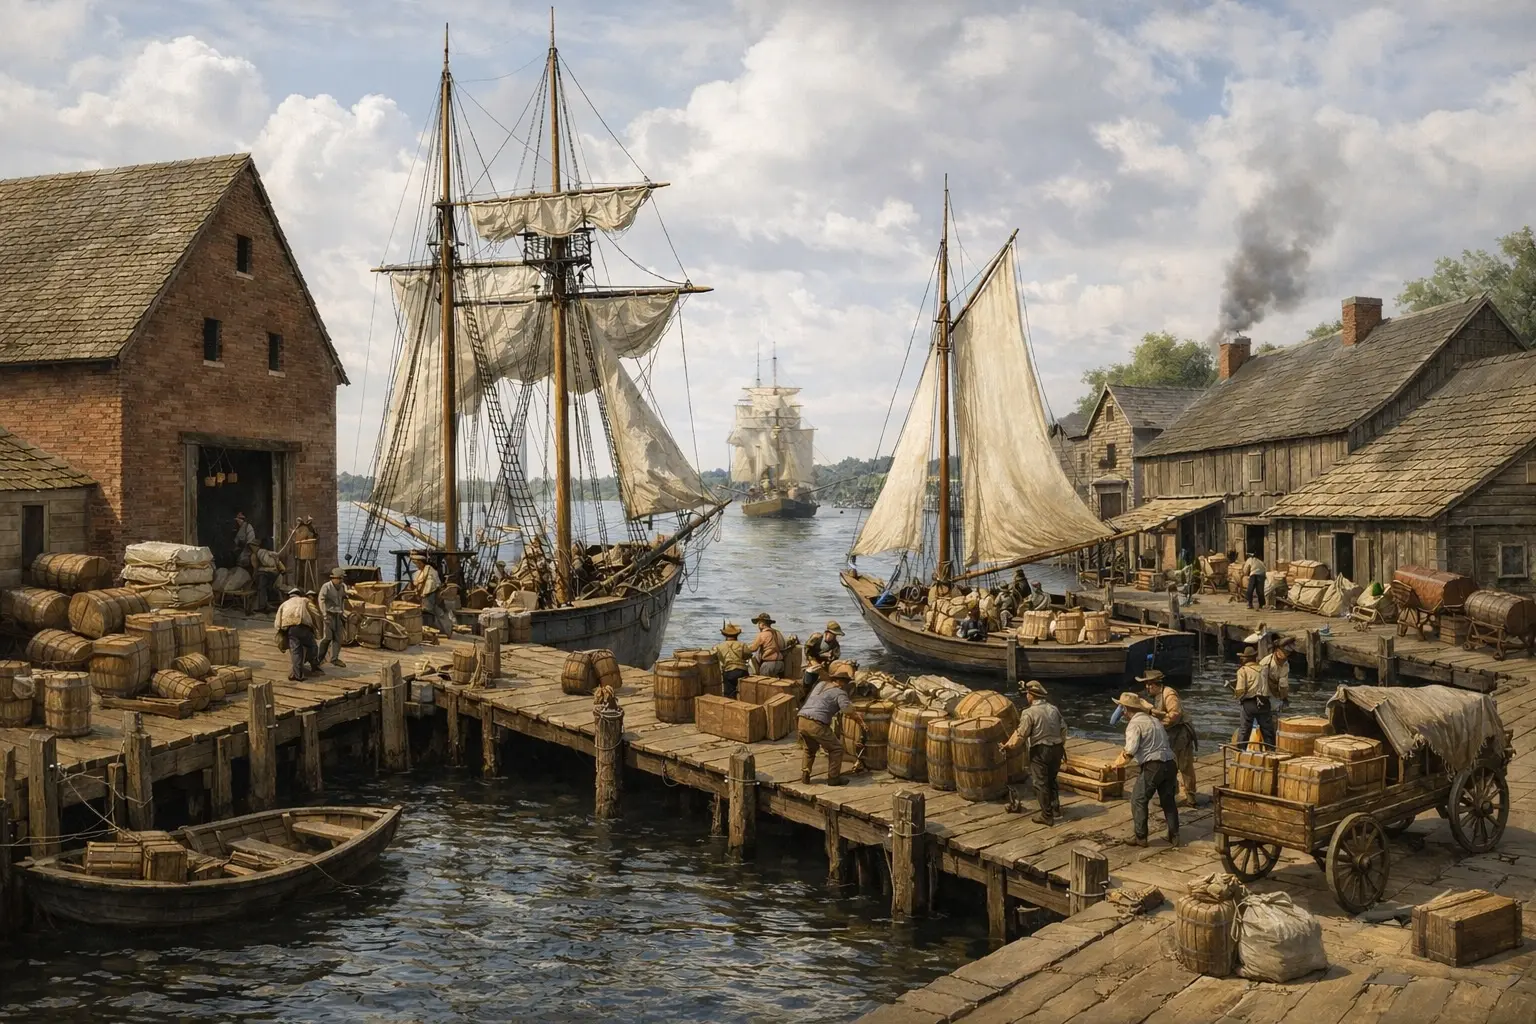 A fanciful view of the waterfront of Alexandria, Virginia, USA in 1780 as visualized by OpenAI's ChatGPT.
From the Charter's website: "For a heritage visualization to match the rigour of conventional research, its rigour must be visible. That is why, at the heart of The London Charter is the principle that heritage visualizations: ‘should accurately convey to users the status of the knowledge that they represent, such as distinctions between evidence and hypothesis, and between different levels of probability.’"
At the heart of Running Reality isn't a map, but a data set that carries citations and can be viewed and audited and improved. Separate from the data, there is a history engine that translates that data set into the map and into history playing out on that map.
Documenting "Why"
Historical data is inherently uncertain. It is not sufficient to show the data with only a credit to who owns the data. A core principle of historical research is documenting WHY the data is as presented. In a historical work in narrative form, one expects extensive footnotes and citations, not because of copyright, but because it serves as an open, verifiable paper trail of the fidelity of the data. Not all data is going to be high fidelity, because historical research is a journey where new discoveries and new assessments are always moving the state of knowledge forward. And sadly, much about history may never be known with high fidelity because knowledge wasn't recorded, the artifacts are lost, or the written record has been lost.
Modern online maps, especially those that use Javascript map libraries like OpenLayers, Leaflet, or Mapbox, are geared toward attributing copyright. Much of the data in these maps comes from various sources, such as satellite imagery, that license their data but retain copyright. For sources such as OpenStreetMap, the copyright may be held by the many individual contributors. This approach assumes that all data is of high fidelity and as accurate as can be measured and copyright is the only attribution needed. This is entirely appropriate for modern maps of the modern world, but Running Reality has to go further.
With historical maps, and especially with 3D reconstructions, the need for citation is even greater but the methodology is weaker. The London Charter sets out principles to guide the methodology of sites like Running Reality. For instance, there are no established practical guidelines for visualizing the inferred roof materials of a building. It might be a very good inference that a roof was made of tile, but would you render it in a different color, like white? In wireframe? Just as the known parts of the building but with an annotating label? Carry a citation in the metadata? While there may not be a standard approach, the London Charter emphasizes how critical it is that each project at least have a method.
Examples
While there is no single best practice to implementing the London Charter, there are examples from other visualizations and digital history projects.
The Atlas of Ancient Rome," 2017 Carandini takes a very through approach that is close to a best practice for printed material. Carandini documented each structure in Rome in multiple diagrams, including both a realistic visualization of the reconstructed structure and a diagram which traces individual building elements to specific sources. There is a clear color coding provided in a legend to each diagram, with categories such as "Archeological data," "Literary sources," and "Ancient iconography." The book also has a second volume with additional details of each citation.

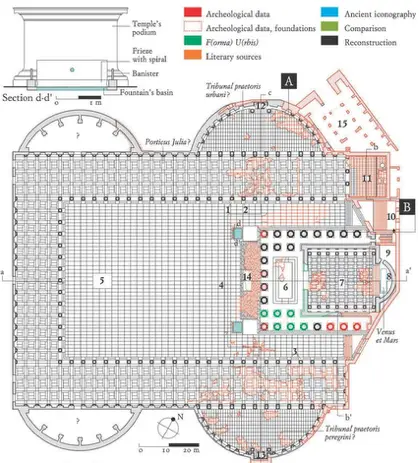 Color coding by source of elements in a structure.
This approach thoroughly documents the structure piece by piece so that everything is very clear and traceable. This works well when there can be multiple diagrams: color can be used to denote source in one of the diagrams and color can be more realistic to the building's materials in other diagrams.
Another approach is the RELEVEN Project, a digital "Reassessment" of the ELEVENth century. Per their website, "the novel aspect of this methodology is that it takes to its logical conclusion something that historians all readily acknowledge and that is especially apparent for pre-modern history: that there are very few, if any, simple and undisputed facts." They are taking a "five pointed star" approach. The "star" is a five-element STructured Assertion Record (STAR) that expands on the traditional RDF-style three-element data structure. An RDF tuple contains a subject → predicate → object. The STAR adds one element to document who is making the assertion and a second element for the basis of that assertion. This lets people reviewing the data at a later time assess for themselves the fidelity of the data.
Running Reality uses a factoid model for all data, which also has five elements and is also similar to an RDF tuple. A tuple contains a subject → predicate → object. A factoid contains the subject, relationship (i.e. predicate), object, date, and fidelity (i.e. citation).
Finally, artistic representations are common. It is generally acceptable to represent buildings as artistic images, even in a museum setting. The purpose of such a representation is not to convey data or to imply complete knowledge of a site. Rather, it is to give visitors and viewers an understanding of what life would have been like in that place and time. An artistic license is presumed by visitors, even without it being explicitly noted. There are innumerable such representations in both traditional media and now online in digital media. There are many projects doing 3D city or building reconstructions and even 3D games making effort at some historical accuracy.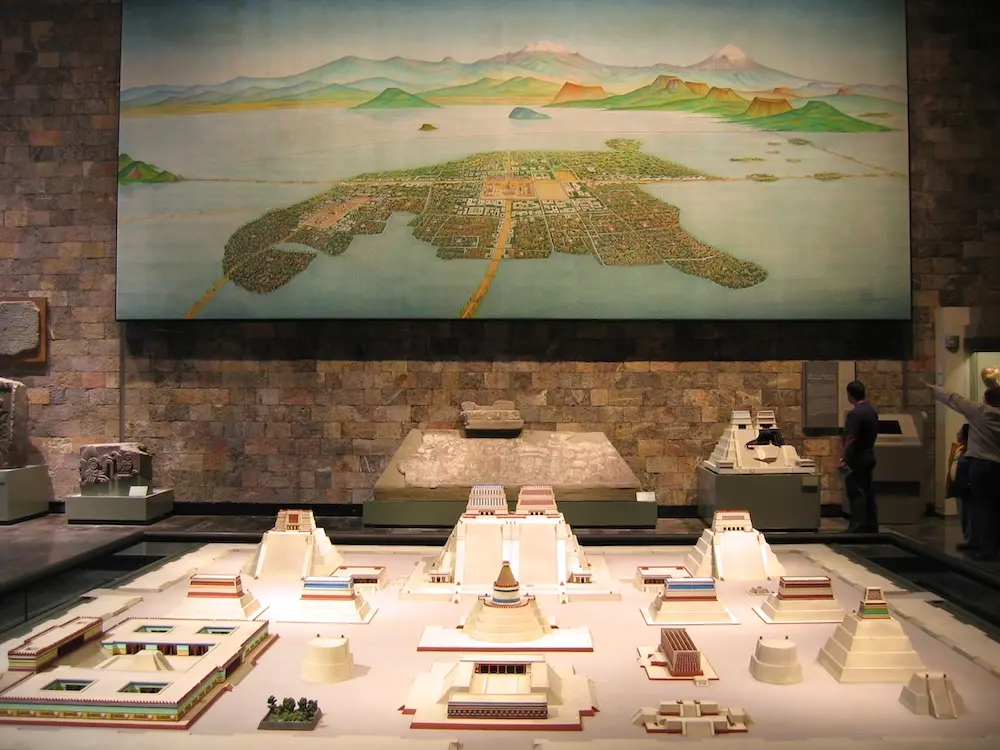
Principles
These are the six principles of the London Charter. They are very well considered and Running Reality attempts to follow these principles.
-
Principle 1 - Implementation
The principles of the London Charter are valid wherever computer-based visualisation is applied to the research or dissemination of cultural heritage.
- Details
- 1.1 Each community of practice, whether academic, educational, curatorial or commercial, should develop London Charter Implementation Guidelines that cohere with its own aims, objectives and methods.
- 1.2 Every computer-based visualisation heritage activity should develop, and monitor the application of, a London Charter Implementation Strategy.
- 1.3 In collaborative activities, all participants whose role involves either directly or indirectly contributing to the visualisation process should be made aware of the principles of the London Charter, together with relevant Charter Implementation Guidelines, and to assess their implications for the planning, documentation and dissemination of the project as a whole.
- 1.4 The costs of implementing such a strategy should be considered in relation to the added intellectual, explanatory and/or economic value of producing outputs that demonstrate a high level of intellectual integrity.
-
Principle 2 - Aims and Methods
A computer-based visualisation method should normally be used only when it is the most appropriate available method for that purpose.
- Details
- 2.1 It should not be assumed that computer-based visualisation is the most appropriate means of addressing all cultural heritage research or communication aims.
- 2.2 A systematic, documented evaluation of the suitability of each method to each aim should be carried out, in order to ascertain what, if any, type of computer-based visualisation is likely to prove most appropriate.
- 2.3 While it is recognised that, particularly in innovative or complex activities, it may not always be possible to determine, a priori, the most appropriate method, the choice of computer-based visualisation method (e.g. more or less photo-realistic, impressionistic or schematic; representation of hypotheses or of the available evidence; dynamic or static) or the decision to develop a new method, should be based on an evaluation of the likely success of each approach in addressing each aim.
-
Principle 3 - Research Sources
In order to ensure the intellectual integrity of computer-based visualisation methods and outcomes, relevant research sources should be identified and evaluated in a structured and documented way.
- Details
- 3.1 In the context of the Charter, research sources are defined as all information, digital and non-digital, considered during, or directly influencing, the creation of computer-based visualisation outcomes.
- 3.2 Research sources should be selected, analysed and evaluated with reference to current understandings and best practice within communities of practice.
- 3.3 Particular attention should be given to the way in which visual sources may be affected by ideological, historical, social, religious and aesthetic and other such factors.
-
Principle 4 - Documentation
Sufficient information should be documented and disseminated to allow computer-based visualisation methods and outcomes to be understood and evaluated in relation to the contexts and purposes for which they are deployed.
- Details
- 4.1 Documentation strategies should be designed and resourced in such a way that they actively enhance the visualisation activity by encouraging, and helping to structure, thoughtful practice.
- 4.2 Documentation strategies should be designed to enable rigorous, comparative analysis and evaluation of computer-based visualisations, and to facilitate the recognition and addressing of issues that visualisation activities reveal.
- 4.3 Documentation strategies may assist in the management of Intellectual Property Rights or privileged information.
- 4.4 It should be made clear to users what a computer-based visualisation seeks to represent, for example the existing state, an evidence-based restoration or an hypothetical reconstruction of a cultural heritage object or site, and the extent and nature of any factual uncertainty.
- 4.5 A complete list of research sources used and their provenance should be disseminated.
- 4.6 Documentation of the evaluative, analytical, deductive, interpretative and creative decisions made in the course of computer-based visualisation should be disseminated in such a way that the relationship between research sources, implicit knowledge, explicit reasoning, and visualisation-based outcomes can be understood.
- 4.7 The rationale for choosing a computer-based visualisation method, and for rejecting other methods, should be documented and disseminated to allow the activity's methodology to be evaluated and to inform subsequent activities.
- 4.8 A description of the visualisation methods should be disseminated if these are not likely to be widely understood within relevant communities of practice.
- 4.9 Where computer-based visualisation methods are used in interdisciplinary contexts that lack a common set of understandings about the nature of research questions, methods and outcomes, project documentation should be undertaken in such a way that it assists in articulating such implicit knowledge and in identifying the different lexica of participating members from diverse subject communities.
- 4.10 Computer-based visualisation outcomes should be disseminated in such a way that the nature and importance of significant, hypothetical dependency relationships between elements can be clearly identified by users and the reasoning underlying such hypotheses understood.
- 4.11 Documentation should be disseminated using the most effective available media, including graphical, textual, video, audio, numerical or combinations of the above.
- 4.12 Documentation should be disseminated sustainably with reference to relevant standards and ontologies according to best practice in relevant communities of practice and in such a way that facilitates its inclusion in relevant citation indexes.
-
Principle 5 - Sustainability
Strategies should be planned and implemented to ensure the long-term sustainability of cultural heritage-related computer-based visualisation outcomes and documentation, in order to avoid loss of this growing part of human intellectual, social, economic and cultural heritage.
- Details
- 5.1 The most reliable and sustainable available form of archiving computer-based visualisation outcomes, whether analogue or digital, should be identified and implemented.
- 5.2 Digital preservation strategies should aim to preserve the computer-based visualisation data, rather than the medium on which they were originally stored, and also information sufficient to enable their use in the future, for example through migration to different formats or software emulation.
- 5.3 Where digital archiving is not the most reliable means of ensuring the long-term survival of a computer-based visualisation outcome, a partial, two-dimensional record of a computer-based visualisation output, evoking as far as possible the scope and properties of the original output, should be preferred to the absence of a record.
- 5.4 Documentation strategies should be designed to be sustainable in relation to available resources and prevailing working practices.
-
Principle 6 - Access
The creation and dissemination of computer-based visualisation should be planned in such a way as to ensure that maximum possible benefits are achieved for the study, understanding, interpretation, preservation and management of cultural heritage.
- Details
- 6.1 The aims, methods and dissemination plans of computer-based visualisation should reflect consideration of how such work can enhance access to cultural heritage that is otherwise inaccessible due to health and safety, disability, economic, political, or environmental reasons, or because the object of the visualisation is lost, endangered, dispersed, or has been destroyed, restored or reconstructed.
- 6.2 Projects should take cognizance of the types and degrees of access that computer-based visualisation can uniquely provide to cultural heritage stakeholders, including the study of change over time, magnification, modification, manipulation of virtual objects, embedding of datasets, instantaneous global distribution.
Approach
Running Reality believes it is critical to make available high-quality 3D visualizations that balance the need for an immersive historical experience with the need for research rigor. We will strive to adhere to the London Principles while carefully using Generative AI. We will make sure to extend the citation and sourcing approach we have used for other data into the 3D world. We will be respectful of people's trust.
Running Reality is taking multiple approaches to representing uncertainty in its visualizations. Our migration to a more immersive 3D model is underway and we are doing it in steps to get feedback on each step.
We are being careful in implementing this system to factor in the following:
- The same history engine inference system must be able to interpolate and extrapolate data over time.
- The source of the data must remain transparent and auditable, even if the structure contains a mixture of provenance.
- Uncertain and composite data, where height, material, architectural style, and condition may be separately cited factoids.
- There is linked data, such as interior spaces being linkable to people or businesses.
- Generative AI is making detailed 3D models more available, but with an extra burden of citation.
Using generative AI with historical drawings, illustrations, and photographs offers an tremendous opportunity. With generative AI, we can quickly build 3D models that are at the same level of historical accuracy as the source material. This can strongly enhance the sense of immersion in history while introducing a defined, transparent, and traceable level of inference.
As an example, here is our basic 2D and basic 3D augmented reality view of the Carlyle Warehouse on the Alexandria, Virginia, waterfront in about 1780. The building's dimensions are known from excavation, as is the basic wooden material. The site of the building is now roughly located under the present-date Indigo Hotel. However, rendering the warehouse as a plain block of wood with those dimensions is not very compelling.
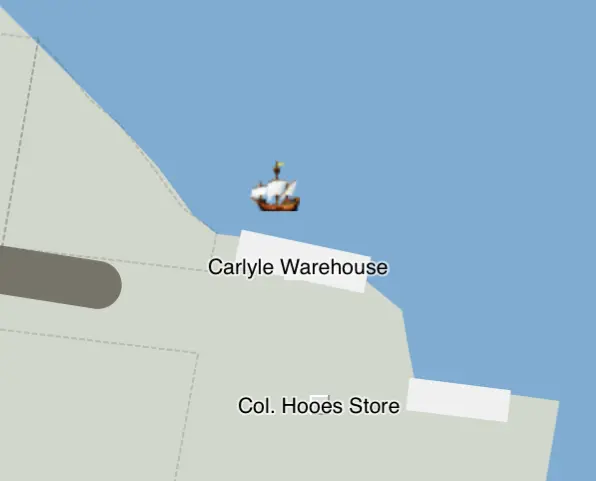 Our basic 2D map of the waterfront of Alexandria, VA.
 The basic map data rendering in 3D augmented reality while standing in Alexandria, VA.
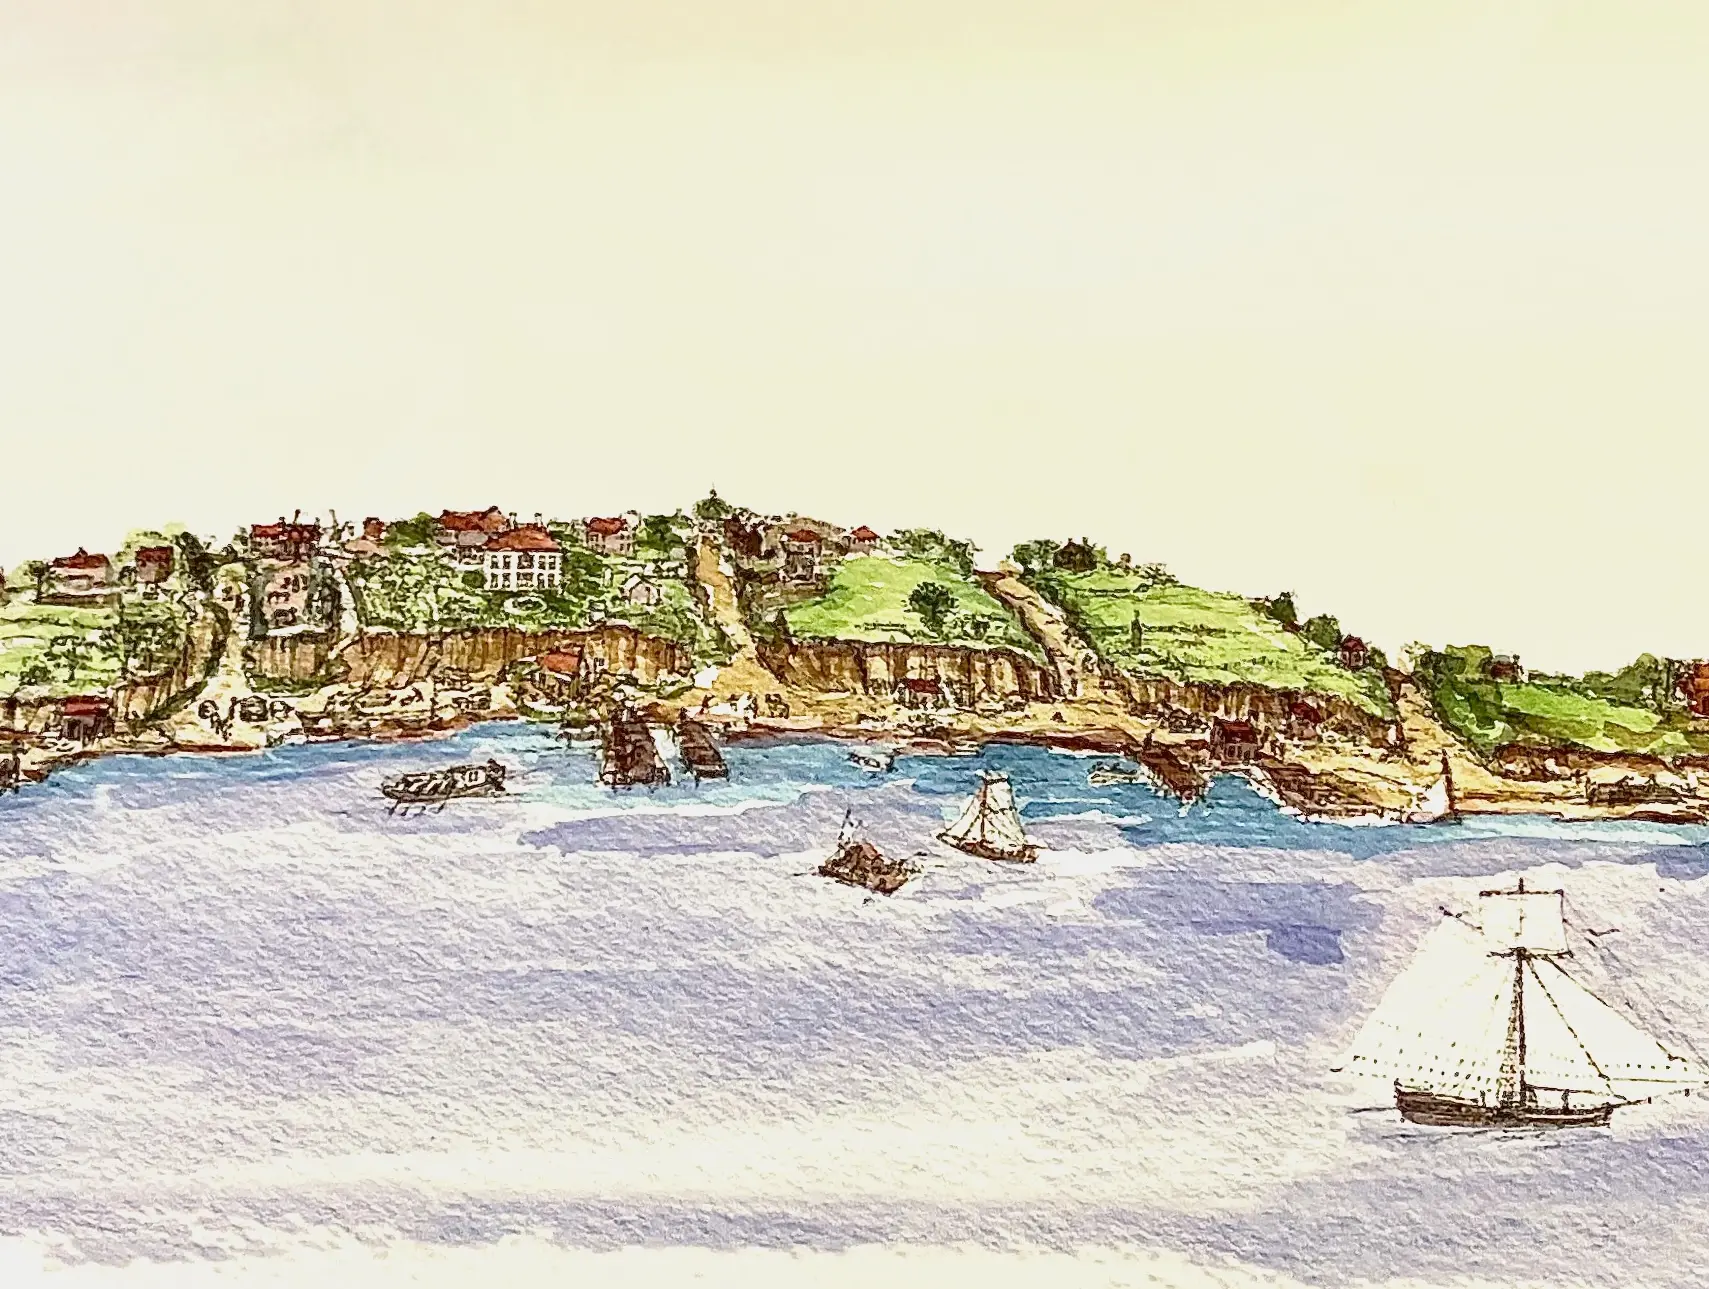
There is an artist's rendering of the Alexandria waterfront representing this era that hangs in the Alexandria Archaeological Museum two blocks away from the warehouse site. The artists has attempted to properly represent Alexandria at this time, and though there is some artistic interpretation, it is considered sufficiently accurate to hang in the museum to give people an immersive understanding of Alexandria. It is understood by visitors not to be data, but art serving a purpose.
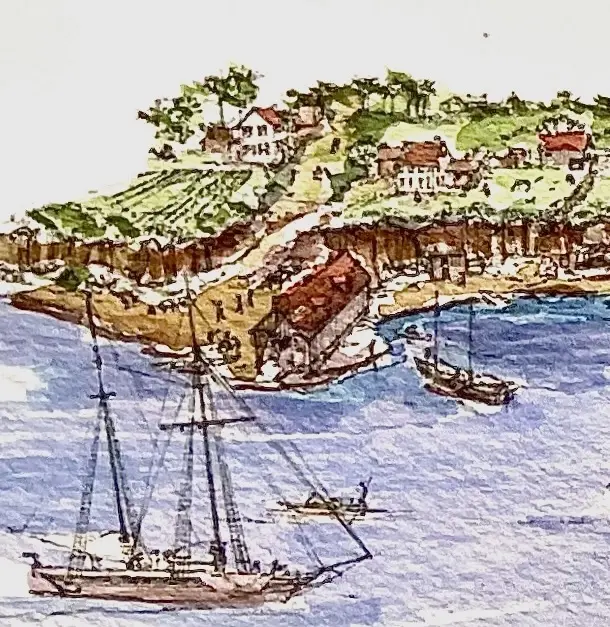
We used generative AI to create a 3D model that follows from the artists impression. This is similar to how such art was used to train the generative AI model used to create the fanciful scene at the top of this article. When asked to perform a more narrow task of creating this single warehouse and to use a specifically citable reference work, we have constrained the inferences made. Further, the 3D model can now be shown in Running Reality alongside other citable data points. When clicking the warehouse, the dates, locations, dimensions, and other data have their citations, and the 3D model has a citation to the artists work.
 An artist's painting of the Alexandria waterfront that hangs in the Alexandria Archaeological Museum.
 The artist's impression of the warehouse was used to guide a generative AI tool to create a 3D model.
 The updated 3D model shown in 3D augmented reality gives a better sense of what the waterfront was like.
Conclusion
The rise of generative AI historical imagery, video, and 3D models is presenting researchers, history students, and enthusiasts with a challenge. We believe that using the principles of the London Charter will provide confidence in Running Reality and the historical visualizations it creates. This doesn't mean avoiding generative AI altogether, but it does mean integrating it carefully into an existing data-driven inference engine already tested and trusted for accuracy and transparency.